- Mailing Lists
- in
- Capacity Planning
Archives
- By thread 5322
-
By date
- June 2021 10
- July 2021 6
- August 2021 20
- September 2021 21
- October 2021 48
- November 2021 40
- December 2021 23
- January 2022 46
- February 2022 80
- March 2022 109
- April 2022 100
- May 2022 97
- June 2022 105
- July 2022 82
- August 2022 95
- September 2022 103
- October 2022 117
- November 2022 115
- December 2022 102
- January 2023 88
- February 2023 90
- March 2023 116
- April 2023 97
- May 2023 159
- June 2023 145
- July 2023 120
- August 2023 90
- September 2023 102
- October 2023 106
- November 2023 100
- December 2023 74
- January 2024 75
- February 2024 75
- March 2024 78
- April 2024 74
- May 2024 108
- June 2024 98
- July 2024 116
- August 2024 134
- September 2024 130
- October 2024 141
- November 2024 171
- December 2024 115
- January 2025 216
- February 2025 140
- March 2025 220
- April 2025 233
- May 2025 239
- June 2025 303
- July 2025 134
Capacity Planning
Capacity Planning
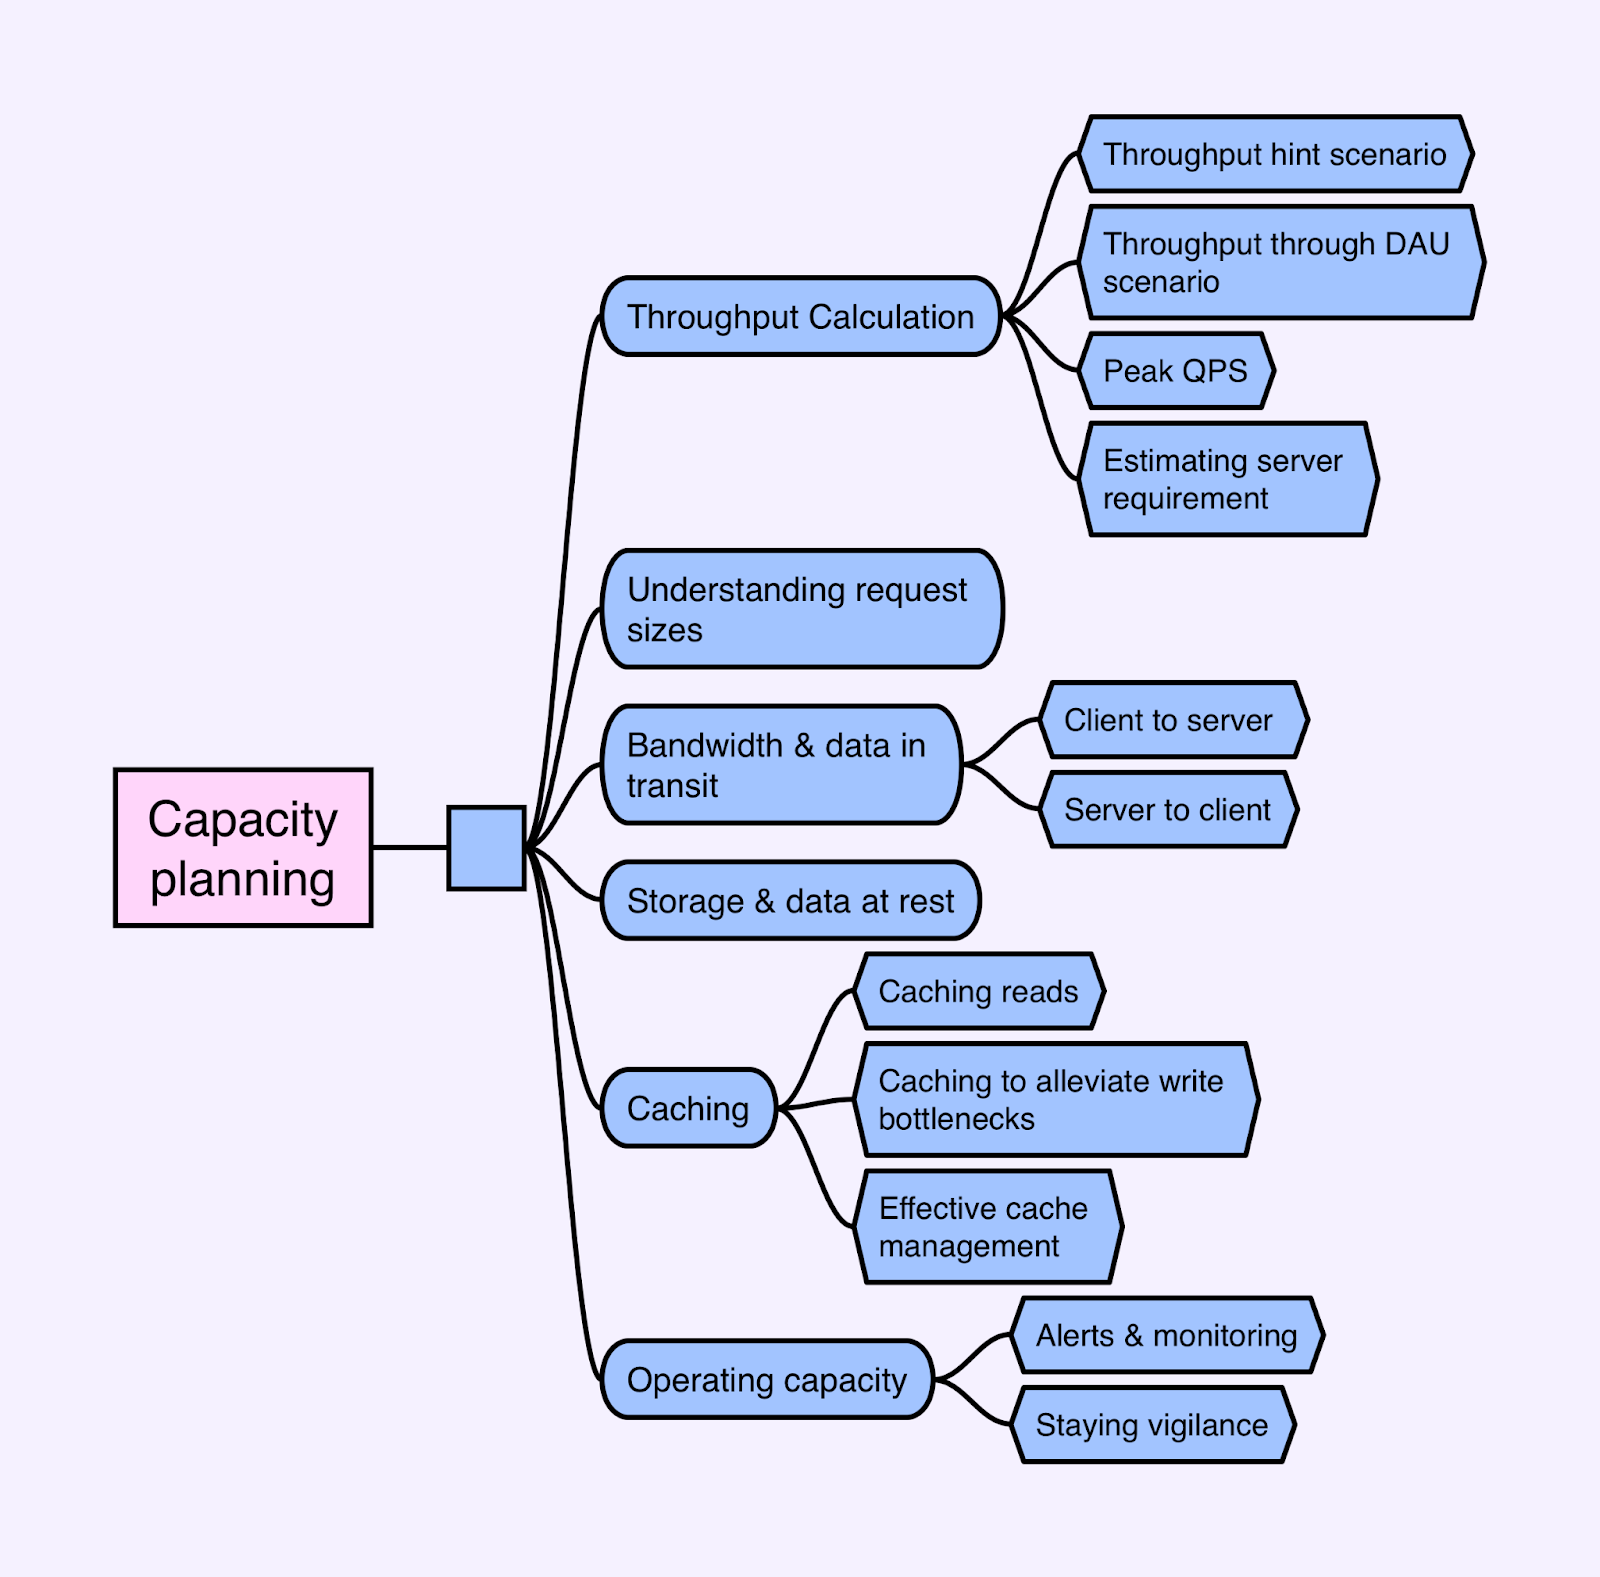
This is a sneak peek of today’s paid newsletter for our premium subscribers. Get access to this issue and all future issues - by subscribing today. Latest articlesIf you’re not a subscriber, here’s what you missed this month: To receive all the full articles and support ByteByteGo, consider subscribing: This newsletter is written by guest author Diego Ballona, who is a senior engineering manager at Spotify. Follow Diego for more on Twitter. Capacity planning plays an integral role in the landscape of real-world system design. This complex exercise, far from being a mere theoretical consideration, is essential for engineers to accurately estimate the capacity needs of their proposed systems. Several reasons underscore the significance of capacity planning in system design:
So, when designing a large-scale system, it’s important to think about capacity planning from the very beginning. By understanding what the system needs to do and how powerful it needs to be, engineers can plan and build systems that are scalable and efficient. Now, let’s explore how capacity planning works in real-world system design. Throughput CalculationIn designing large-scale systems, it is important to estimate the system’s scale in the beginning. Requirements might hint at the throughput, or we may need to infer it from relevant metrics like daily active users. Throughput hint scenarioLet's consider Example 1 - Temperature sensors for a monitoring system. The system needs to measure temperature changes across a county using about 10 million sensors. These sensors report changes every 5 seconds. Analysts use the system to forecast the weather using a dashboard that displays reports. From these requirements, we can infer a few things about the system’s capacity. We can estimate what the throughput is as follows:
So, for this system, a good throughput estimate is about 2 million QPS. Throughput through DAU scenarioSometimes, throughput isn’t evident in the requirements. Let's look at Example 2 - Social Media News Feed: The system allows users to post text, images, and videos on their profile timeline, which is organized chronologically. Users can follow others and see relevant posts from those they follow on their timeline. To inform capacity planning, we could ask:
Then, calculate the throughput based on the feature requirements. If the most relevant posts appear in the timeline on the home page, all daily active users likely interact with it. Assume each user interacts with it a certain number of times per day (e.g., 10 times), it means 5 billion page views per day, or roughly 60k QPS. Profile visits would likely be less frequent than homepage visits. If we assume that each user visits two profile pages per day, that results in an average QPS of about 12k. For posts, let’s assume that on average, only 10% of the daily active users post once per day. This would mean an average QPS of approximately 6k. Remember, these are rough estimates. For most system designs, this is good enough. A good tip is to think in round numbers and round up to ensure conservative estimates. Peak QPSCalculating peak QPS is important as it often dictates the capacity requirement of the design. Peak QPS refers to the highest rate at which a system will be expected to handle queries, often occurring during times of high usage or even traffic spikes. This can be much higher than the average rate. This is why it requires special attention. One common method to determine peak QPS is through historical data analysis. This involves tracking the number of queries that the infrastructure handles over a specific timeframe, like days, weeks, or even months, and then choosing the highest value. This method relies on the availability of data and the system’s historical performance. Overprovisioning the infrastructure or utilizing autoscaling features can also help handle peak QPS. These strategies allow the system to increase its capacity temporarily to deal with unexpected surges in traffic. However, they come with their own costs and need careful cost-benefit analysis. Peak QPS could also be influenced by business requirements or predictable usage patterns. For instance:
To estimate peak QPS, we often make calculations based on expected distribution characteristics. For example, we might assume that 80% of visits per day occur within 20% of the time (a variant of the Pareto Principle). We add some buffer capacity to handle unexpected surges and provide a smooth user experience. In Example 2 - Social Media News Feed, if we anticipate that 80% of pageviews for timelines occur within an 8-hour time span, we’d calculate the peak QPS for this period to be around 138k. However, this is just a starting point - it’s always a good practice to overprovision initially, monitor the data, and then adjust based on the actual usage patterns. Preparing for peak QPS helps ensure that the system remains stable and responsive even under the heaviest loads. This contributes to a better user experience and system reliability. Estimating server requirementWith the estimated throughput and response time, we can estimate the number of servers needed to run the application. In Example 1 - Temperature sensors, the system has an average response time of 200ms and needs to handle 2M QPS, and each application server can manage 32 workers handling 160 QPS, we’d need around 12.5k server instances. Now that we estimated the scale of the overall system, let's focus on the specifics of the system we are designing, starting with request sizing. Understanding request sizesAssessing request sizes is crucial for determining bandwidth and storage requirements. In system design, we often need to accommodate a variety of request types that can significantly impact the load on our system. These could be as simple as GET requests retrieving data or as complex as POST requests that involve large multimedia files. While initial requirements might not include specific request sizes, we can make informed assumptions based on the system’s functionality and the nature of data it handles When it comes to estimating request sizes, different types of systems will naturally have different expectations. Let’s consider the two examples we’ve been discussing: Temperature Sensors and Social Media News Feed. For a system like Example 1 - Temperature Sensors, the data sent may be relatively small. Assuming data is sent in JSON format, we can estimate the size of each field. The temperature is reported as a float (4 bytes), the sensor ID is a UUID (16 bytes), and we have three additional 4-byte fields. Accounting for the JSON format, the total request body size is less than 100 bytes. Including HTTP headers (typically between 200 to 400 bytes), we can conservatively estimate each request size to be around 0.5KB. This is quite small. However, even such small data requests can add up when dealing with millions of sensors, making this an important consideration. For a system like Example 2 - Social Media News Feed, we’re dealing with diverse content types - text, images, and videos. While text posts might only be a few KB, images files could be several hundred KB, and video files could be several MB. In these scenarios, an average request size needs to consider the distribution and size of various content types. Let’s make a conservative estimate of a text-only post being about 1KB, which includes a user ID (UUID) and a free-form string with 250 characters on average. For images and videos, let’s assume that for every 10 posts, there are three images (average size of 300KB after compression), and one is a video (averaging at 1MB). We can fold all these media types into an average to simplify our calculations. This leaves us with an average request size of around 200KB per post. Considerations for Request SizingUnderstanding request sizes is just part of the equation. We must also consider factors like data format, serialization/deserialization, and the impact of these on bandwidth and processing needs.
Request sizing is an important aspect of capacity planning. Although it requires making assumptions, these informed guesses help anticipate the system’s needs. It ensures that we’re well-prepared to handle expected loads and traffic patterns. Bandwidth & data in transitUnderstanding each record’s cost is fundamental. We need to consider the bandwidth per operation in both directions - client to server (ingress) and server to client (egress). Client to server (ingress)In Example 1 - Temperature sensors, the data sent by the sensors to the application is known as ingress: incoming data to the application's network. Suppose each sensor request is 0.5KB and the average QPS is 400k, our average ingress bandwidth is approximately 200MB/second. We can simplify the discussion by leaving out the read path for dashboards, etc., as it probably won’t significantly impact capacity. An interesting aspect to consider is how often we need to send data to the servers. It’s possible that not all data requires immediate transmission. For example, a temperature sensor might only need to report data when a significant temperature change occurs. By storing the temperature state locally on the sensor and transmitting it only upon changes, we could potentially reduce the capacity load and costs. However, it’s important to set a limit for the maximum time a sensor can go without reporting to the server. This ensures that any malfunctioning or offline sensors are promptly identified. Server to client (egress)When considering a system like Example 2 - Social Networking News Feed, posting content would equate to ingress traffic. Based on our previous estimates, suppose each post is 1KB and we’ve got an average of 6k QPS, our ingress bandwidth is about 6MB/second. The egress, or the data transmitted from the server to client, can be complex. Suppose our system paginates every 20 posts, and the server renders raw file versions each time. In this scenario, our average egress bandwidth would be very high at ~250GB/second: But there are optimization strategies to reduce this egress traffic.For example:
Here’s a rough calculation:
We could achieve around 67% saving in our capacity, without caching:... Keep reading with a 7-day free trialSubscribe to ByteByteGo Newsletter to keep reading this post and get 7 days of free access to the full post archives. A subscription gets you:
© 2023 ByteByteGo |
by "ByteByteGo" <bytebytego@substack.com> - 11:41 - 29 Jun 2023

