EP92: Top 5 Kafka use cases

EP92: Top 5 Kafka use cases

This week’s system design refresher: Top 5 Kafka use cases What is OSI Model? Logging, Tracing, Metrics Top 4 Kubernetes Service Types in one diagram Top 5 Kafka use cases Kafka was originally built for massive log processing. It retains messages until expiration and lets consumers pull messages at their own pace.  ‌ ‌ ‌ ‌ ‌ ‌ ‌ ‌ ‌ ‌ ‌ ‌ ‌ ‌ ‌ ‌ ‌ ‌ ‌ ‌ ‌ ‌ ‌ ‌ ‌ ‌ ‌ ‌ ‌ ‌ ‌ ‌ ‌ ‌ ‌ ‌ ‌ ‌ ‌ ‌ ‌ ‌ ‌ ‌ ‌ ‌ ‌ ‌ ‌ ‌ ‌ ‌ ‌ ‌ ‌ ‌ ‌ ‌ ‌ ‌ ‌ ‌ ‌ ‌ ‌ ‌ ‌ ‌ ‌ ‌ ‌ ‌ ‌ ‌ ‌ ‌ ‌ ‌ ‌ ‌ ‌ ‌ ‌ ‌ ‌ ‌ ‌ ‌ ‌ ‌ ‌ ‌ ‌ ‌ ‌ ‌ ‌ ‌ ‌ ‌ ‌ ‌ ‌ ‌ ‌ ‌ ‌ ‌ ‌ ‌ ‌ ‌ ‌ ‌ ‌ ‌ ‌ ‌ ‌ ‌ ‌ ‌ ‌ ‌ ‌ ‌ ‌ ‌ ‌ ‌ ‌ ‌ ‌ ‌ ‌ ‌ ‌ ‌ ‌ ‌ ‌ ‌ ‌ ‌ ‌ ‌ ‌ ‌ ‌ ‌ ‌ ‌ ‌ ‌ ‌ ‌ ‌ ‌ ‌ ‌ ‌ ‌ ‌ ‌ ‌ ‌ ‌ ‌ ‌ ‌ ‌ ‌ ‌ ‌ ‌ ‌ ‌ ‌ ‌ ‌ ‌ ‌ ‌ ‌ ‌ ‌ ‌ ‌ ‌ ‌ ‌ ‌ ‌ ‌ ‌ ‌ ‌ ‌ ‌ ‌
Forwarded this email? Subscribe here for more

Latest articles

If you’re not a subscriber, here’s what you missed this month.

  1. A Crash Course in Docker

  2. A Crash Course in Kubernetes

  3. Redis Can Do More Than Caching

  4. The 6 Most Impactful Ways Redis is Used in Production Systems

  5. The Tech Promotion Algorithm: A Structured Guide to Moving Up

To receive all the full articles and support ByteByteGo, consider subscribing:


This week’s system design refresher:

  • Top 5 Kafka use cases

  • What is OSI Model?

  • Logging, Tracing, Metrics

  • Top 4 Kubernetes Service Types in one diagram


Top 5 Kafka use cases

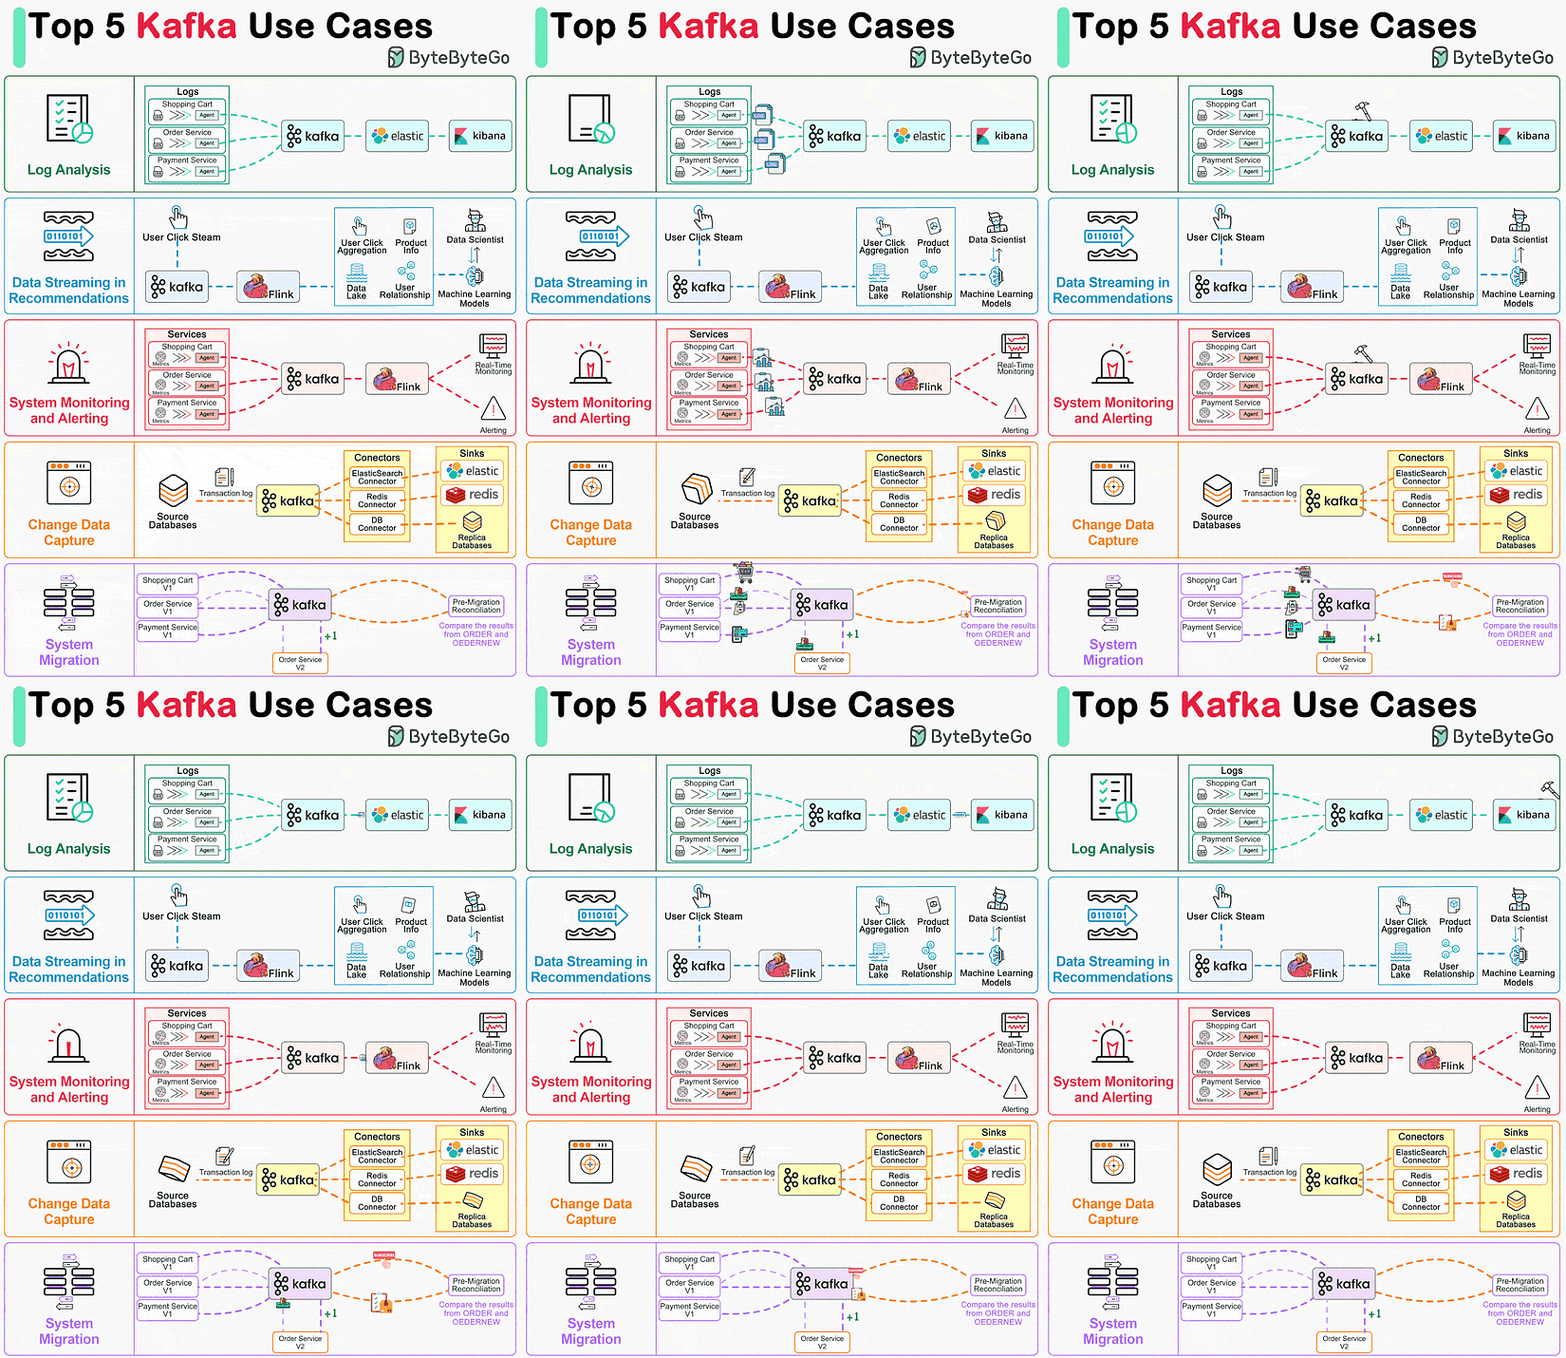
Kafka was originally built for massive log processing. It retains messages until expiration and lets consumers pull messages at their own pace.

No alt text provided for this image

Let’s review the popular Kafka use cases.

  • Log processing and analysis

  • Data streaming in recommendations

  • System monitoring and alerting

  • CDC (Change data capture)

  • System migration

Over to you: Do you have any other Kafka use cases to share?


ByteByteGo Newsletter is a reader-supported publication. To receive new posts and support my work, consider becoming a free or paid subscriber.


What is OSI Model?

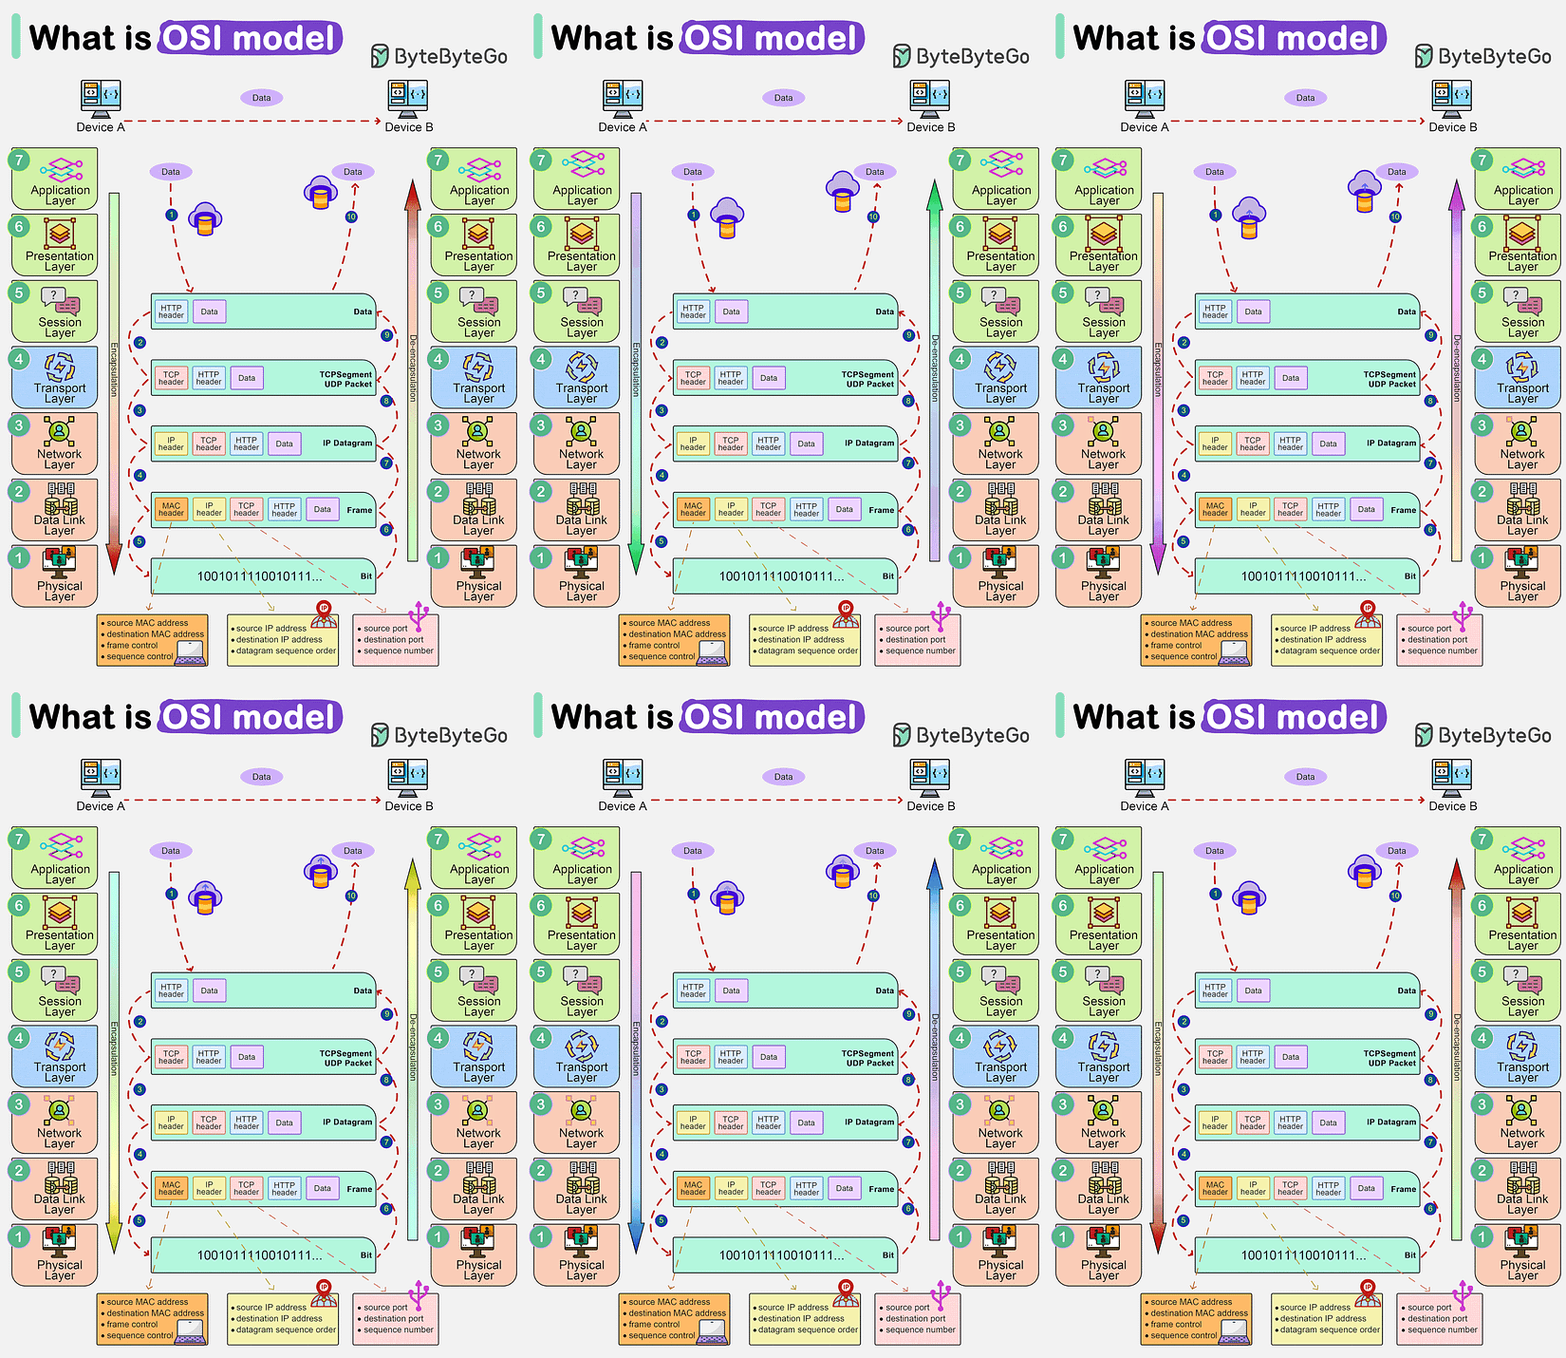
How is data sent over the internet? What does that have to do with the OSI model? How does TCP/IP fit into this?

graphical user interface, application

7 Layers in the OSI model are:

  1. Physical Layer

  2. Data Link Layer

  3. Network Layer

  4. Transport Layer

  5. Session Layer

  6. Presentation Layer

  7. Application Layer


Logging, Tracing, Metrics

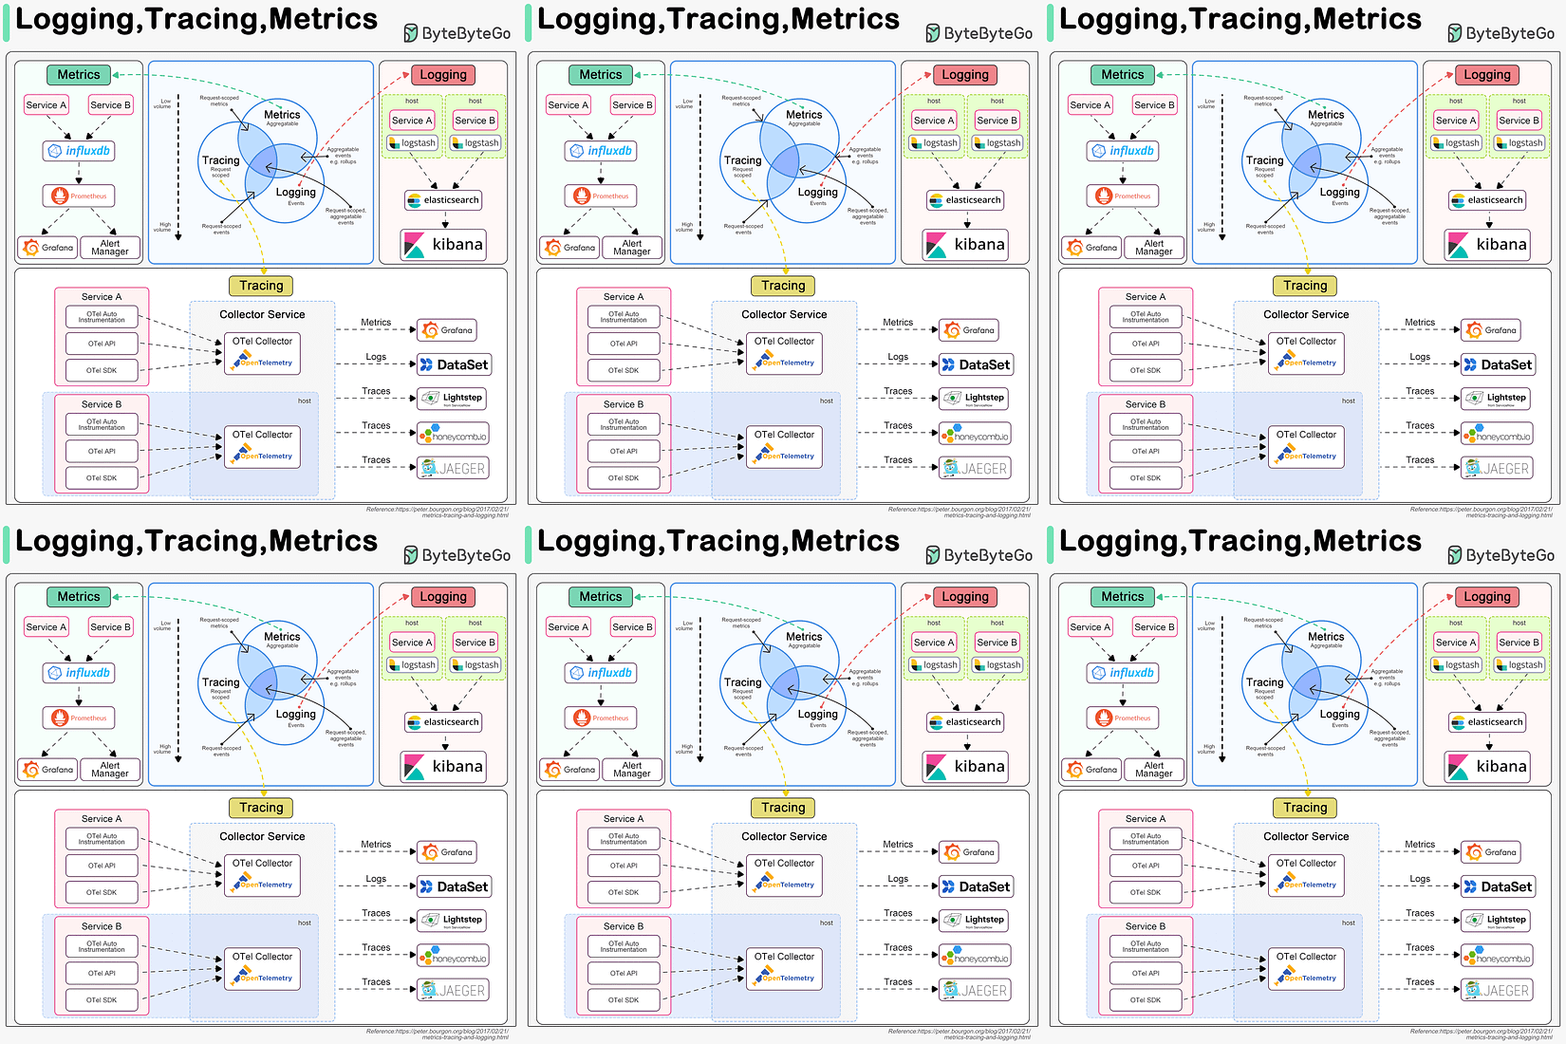
Logging, tracing and metrics are 3 pillars of system observability. The diagram below shows their definitions and typical architectures.

No alt text provided for this image
  • Logging
    Logging records discrete events in the system. For example, we can record an incoming request or a visit to databases as events. It has the highest volume. ELK (Elastic-Logstash-Kibana) stack is often used to build a log analysis platform. We often define a standardized logging format for different teams to implement, so that we can leverage keywords when searching among massive amounts of logs.

  • Tracing
    Tracing is usually request-scoped. For example, a user request goes through the API gateway, load balancer, service A, service B, and database, which can be visualized in the tracing systems. This is useful when we are trying to identify the bottlenecks in the system. We use OpenTelemetry to showcase the typical architecture, which unifies the 3 pillars in a single framework.

  • Metrics
    Metrics are usually aggregatable information from the system. For example, service QPS, API responsiveness, service latency, etc. The raw data is recorded in time-series databases like InfluxDB. Prometheus pulls the data and transforms the data based on pre-defined alerting rules. Then the data is sent to Grafana for display or to the alert manager which then sends out email, SMS, or Slack notifications or alerts.

Over to you: Which tools have you used for system monitoring?


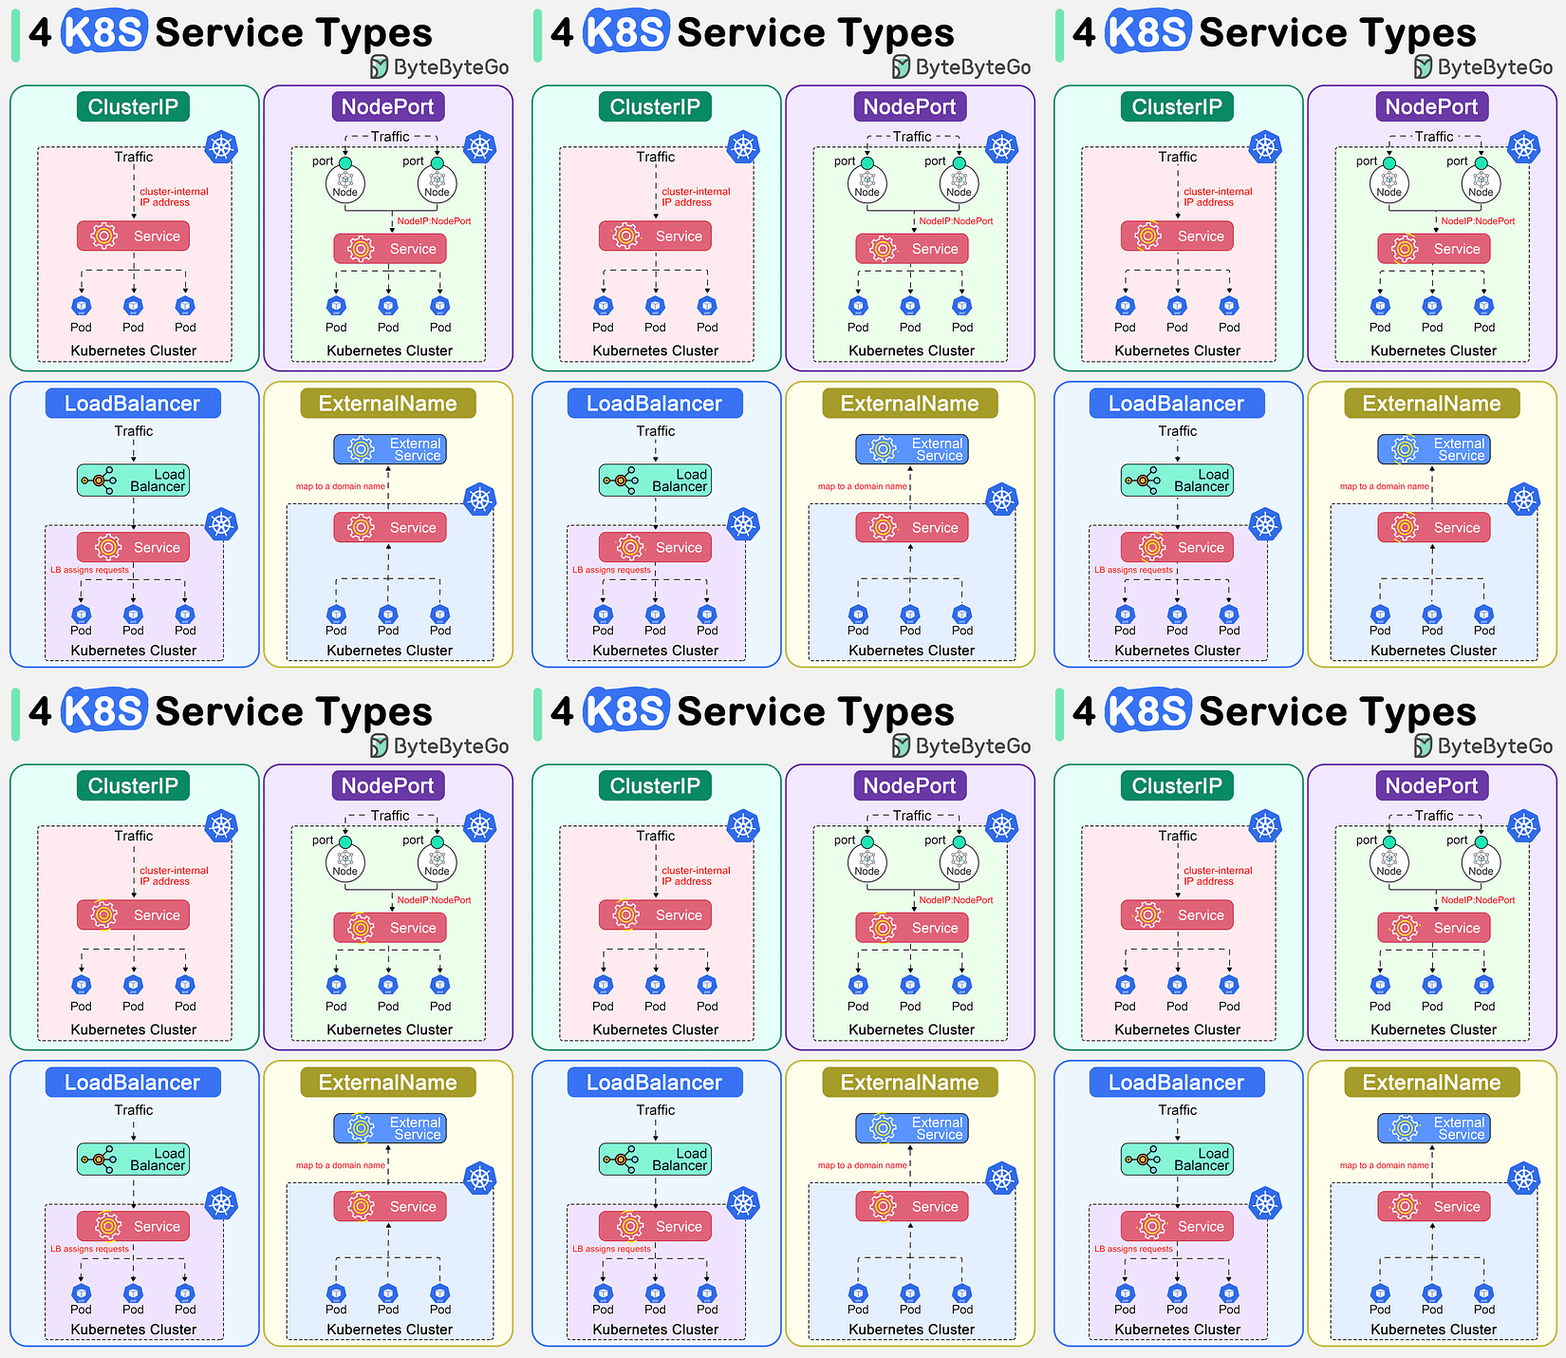
Top 4 Kubernetes Service Types in one diagram

The diagram below shows 4 ways to expose a Service.

No alt text provided for this image

In Kubernetes, a Service is a method for exposing a network application in the cluster. We use a Service to make that set of Pods available on the network so that users can interact with it.

There are 4 types of Kubernetes services: ClusterIP, NodePort, LoadBalancer and ExternalName. The “type” property in the Service's specification determines how the service is exposed to the network.

  • ClusterIP
    ClusterIP is the default and most common service type. Kubernetes will assign a cluster-internal IP address to ClusterIP service. This makes the service only reachable within the cluster.

  • NodePort
    This exposes the service outside of the cluster by adding a cluster-wide port on top of ClusterIP. We can request the service by NodeIP:NodePort.

  • LoadBalancer
    This exposes the Service externally using a cloud provider’s load balancer.

  • ExternalName
    This maps a Service to a domain name. This is commonly used to create a service within Kubernetes to represent an external database.

 
Like
Comment
Restack
 

© 2023 ByteByteGo
548 Market Street PMB 72296, San Francisco, CA 94104
Unsubscribe

Get the appStart writing


by "ByteByteGo" <bytebytego@substack.com> - 11:37 - 30 Dec 2023