Microservices are awesome, but monitoring them can be...not awesome.
As you break down your monolithic application into microservices, or build brand new cloud-native applications, your teams gain more autonomy, speed, and freedom.
But troubleshooting containerized environments gets increasingly difficult as infrastructure is abstracted away from the people actually responsible for shipping and maintaining code.
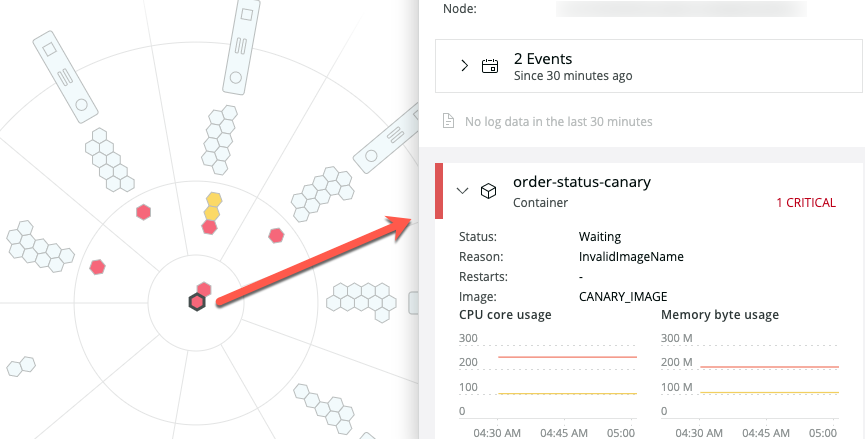
Fortunately, New Relic One Kubernetes cluster explorer provides multidimensional views in a curated UI that simplifies complex environments and enables you to view, troubleshoot, and alert on the most important parts of your cluster.

To set up Kubernetes monitoring within New Relic One today, follow our Getting Started guide to activate your integration.
Happy Monitoring,
Max
