- Mailing Lists
- in
- The week in charts
Archives
- By thread 5193
-
By date
- June 2021 10
- July 2021 6
- August 2021 20
- September 2021 21
- October 2021 48
- November 2021 40
- December 2021 23
- January 2022 46
- February 2022 80
- March 2022 109
- April 2022 100
- May 2022 97
- June 2022 105
- July 2022 82
- August 2022 95
- September 2022 103
- October 2022 117
- November 2022 115
- December 2022 102
- January 2023 88
- February 2023 90
- March 2023 116
- April 2023 97
- May 2023 159
- June 2023 145
- July 2023 120
- August 2023 90
- September 2023 102
- October 2023 106
- November 2023 100
- December 2023 74
- January 2024 75
- February 2024 75
- March 2024 78
- April 2024 74
- May 2024 108
- June 2024 98
- July 2024 116
- August 2024 134
- September 2024 130
- October 2024 141
- November 2024 171
- December 2024 115
- January 2025 216
- February 2025 140
- March 2025 220
- April 2025 233
- May 2025 239
- June 2025 303
- July 2025 4
The week in charts
The Week in Charts
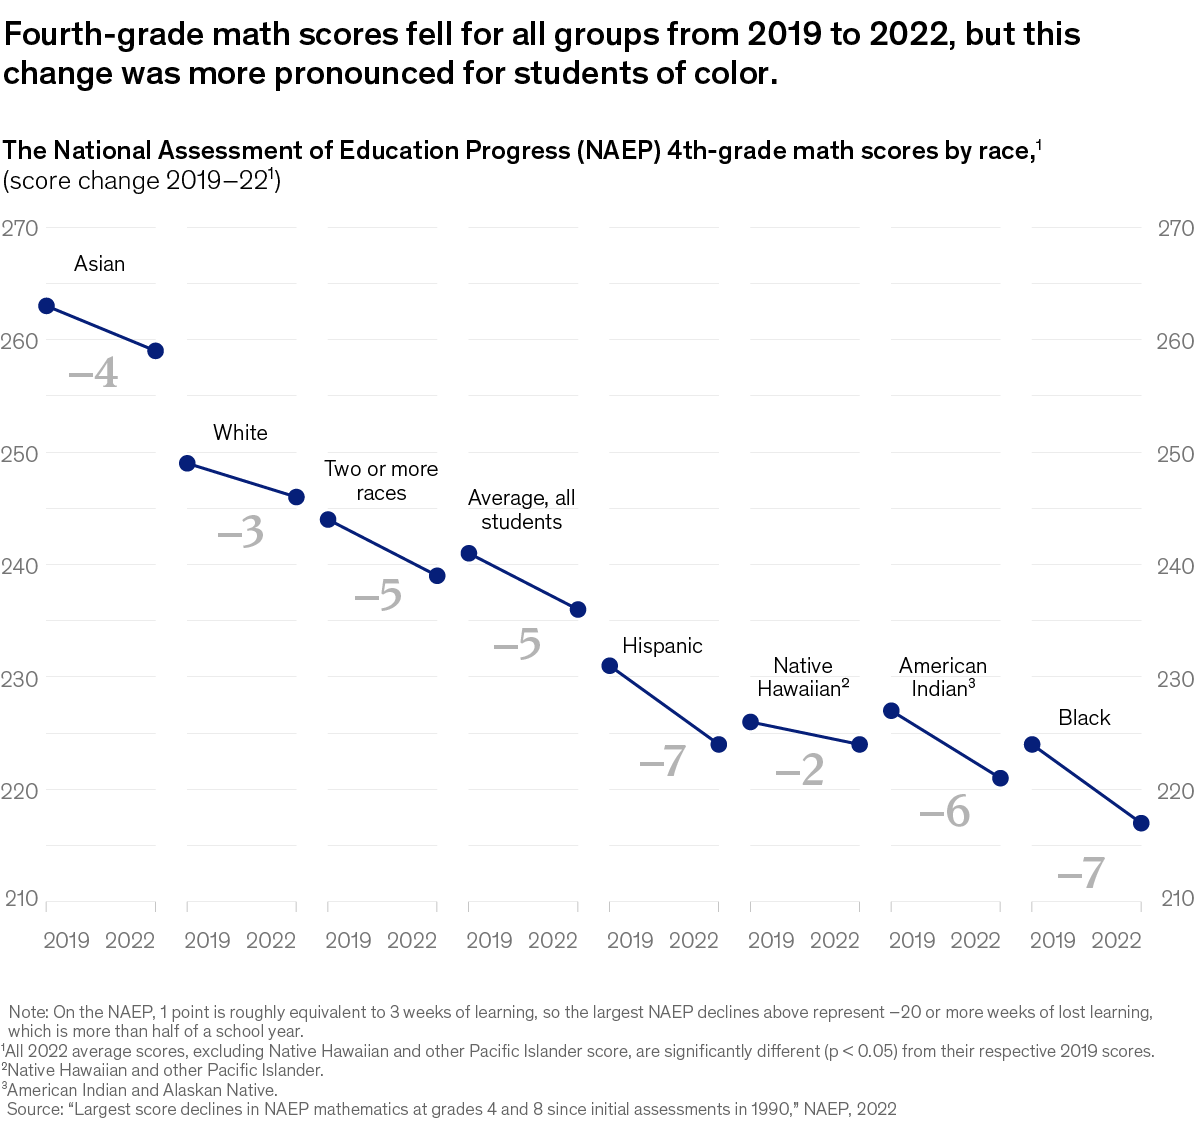
Educational disparities, gen AI and jobs, and more
|
by "McKinsey Week in Charts" <publishing@email.mckinsey.com> - 03:38 - 9 Sep 2023


